
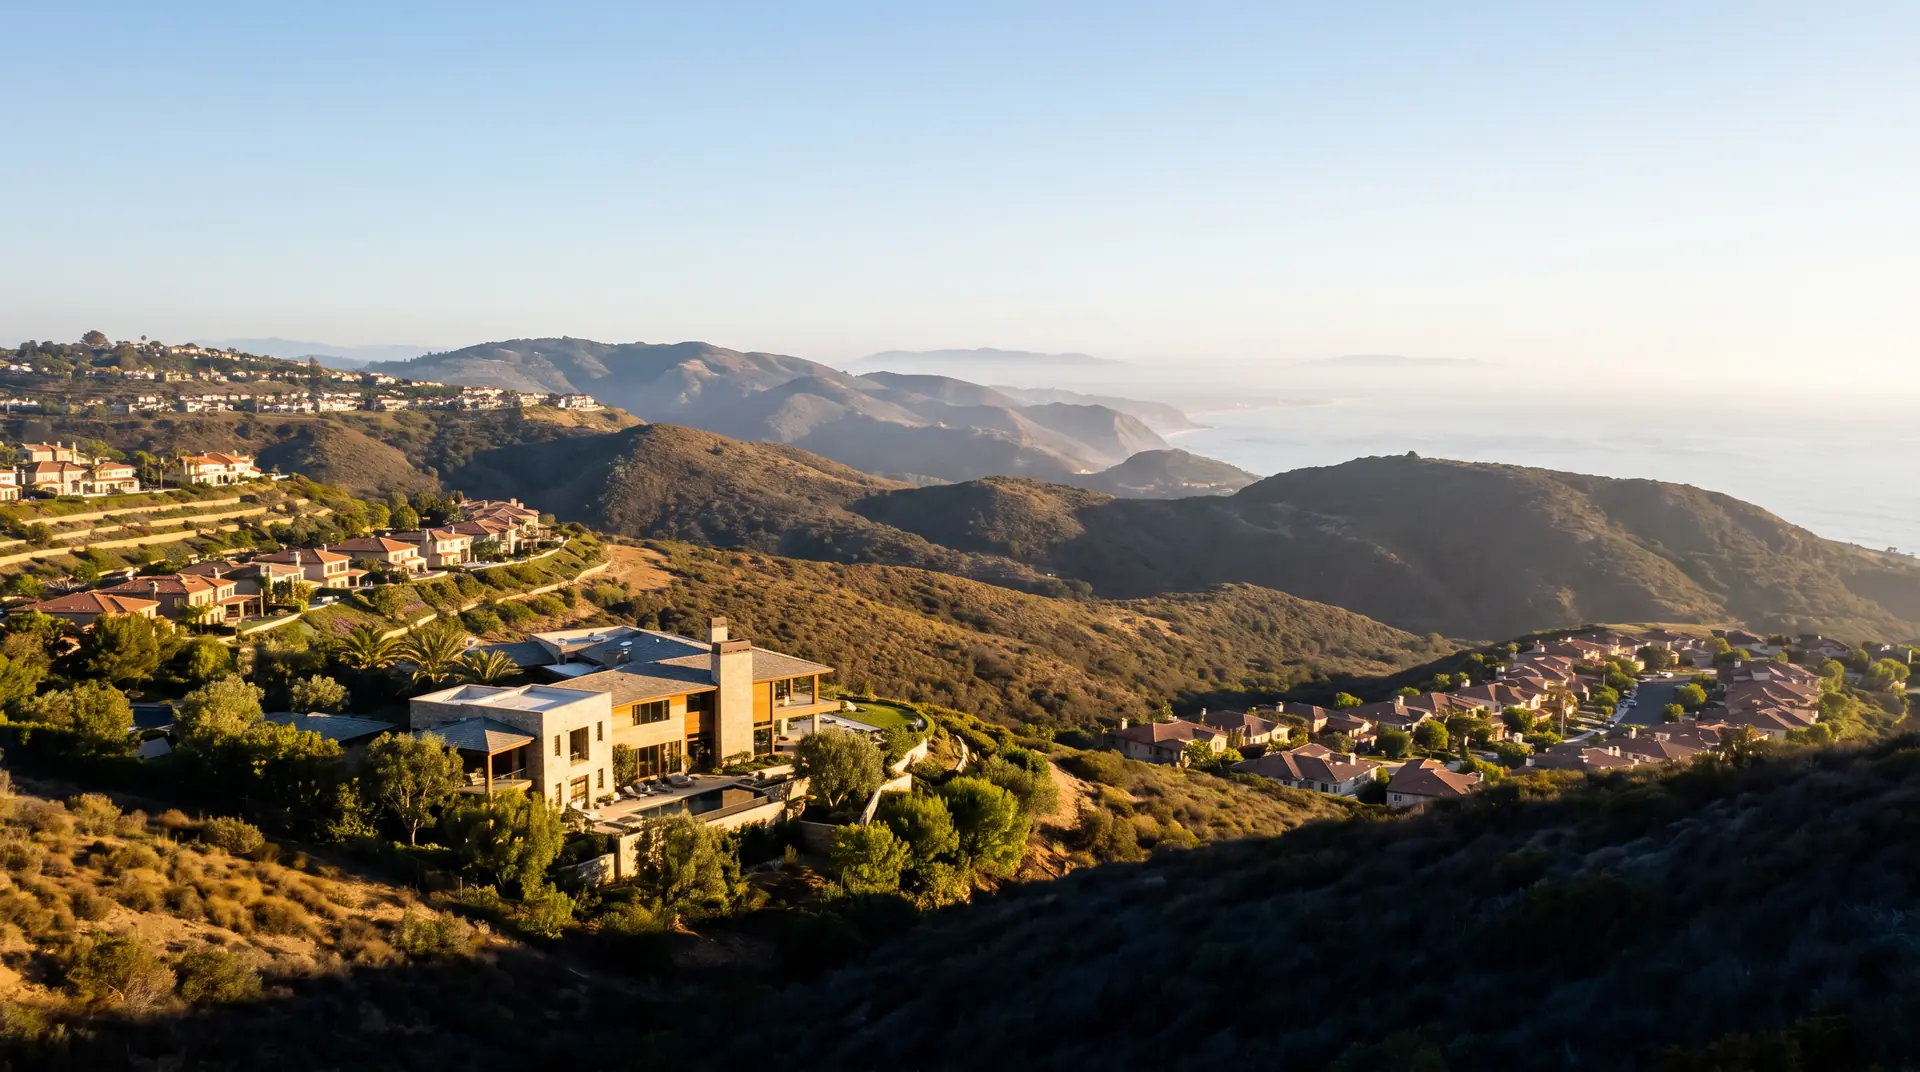
Orange County housing market:
October 2026
The October 2026 Orange County housing market report covers sales closed in September 2026. The county median sale price was $1,207,298. Homes sold that month: 1,805. Median days on market: 47. Sale-to-list ratio: 98.8%. Change in the median on a year earlier: +0.6%.
Greg reviews every request and replies with a written valuation.
This Orange County housing market October 2026 report was written by Greg Toussieng, broker, DRE #01495415, and published in October 2026; the figures stand until the November 2026 report replaces them.
What happened in the Orange County housing market in October 2026's report?
This report covers homes that closed in September 2026, the latest full month of data available in October 2026. The county median sale price was $1,207,298, a change of +0.6% on a year earlier, and 1,805 homes sold in the county that month.
The pace and the pricing tell you who had the edge. The median home went under contract in 47 days and sold at 98.8% of its list price. Read those two together: homes selling at or above list within a few weeks favour sellers, and longer days with sales below list give buyers room. The county figure blends condos with bayfront estates, so the city table below is the better guide to any one place, and the sales on your own street are better still. Each figure is dated, sourced and free to quote with a link back to this page.
Orange County · September 2026 · Source: Redfin Data Center
How did each city move?
Each city with a guide is listed below for the same month and source. A city with fewer than 10 sales in the month shows no median.
| Place | Median sale price | 12-month change | Median days on market | Sale-to-list | Homes sold |
|---|---|---|---|---|---|
| Newport Beach | $3,848,167 | +13.2% | 65 | 96.9% | 284 |
| Irvine | $1,449,310 | -6.5% | 61 | 97.5% | 556 |
| Santa Ana | $849,595 | +3.7% | 44 | 99.8% | 206 |
| Orange County | $1,207,298 | +0.6% | 47 | 98.8% | 1,805 |
The three cities sit in very different places in the county's market. Newport Beach is far smaller, with 85,239 residents at the 2020 census against more than 300,000 each in Irvine and Santa Ana, and it carries the highest median of the three, so a couple of bayfront or Newport Coast closings can move its figure noticeably in one month. Irvine sells many more homes across dozens of villages, and builders' new homes compete with its resales. Santa Ana's median depends on the share of condos in the month's sales, because its detached houses and its condos trade at very different prices.
What homes sell for, from Seal Beach to San Clemente.
Eight places, down the coast and back to the office in Santa Ana: what homes sold for and how fast they went.
Every gold dot opens a full guide. The complete list is below the map.
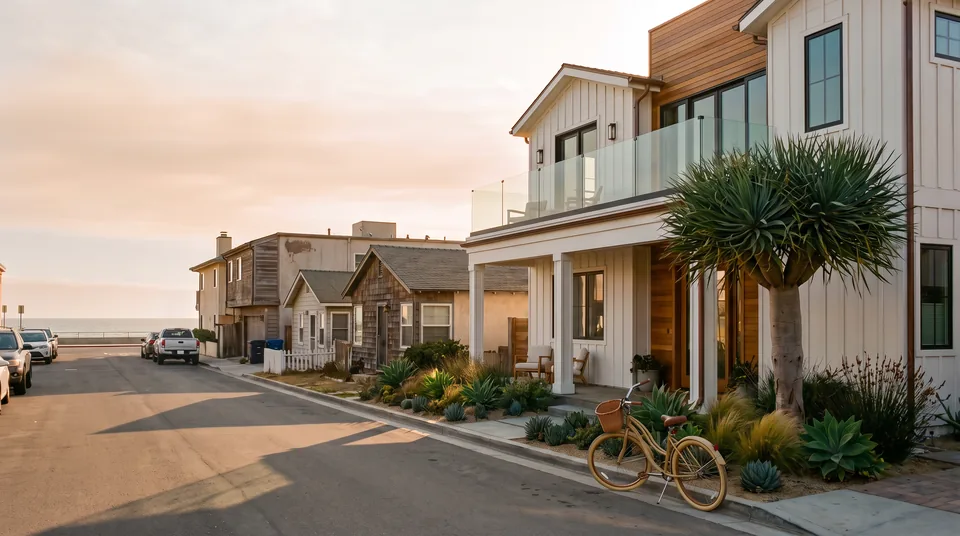 CityHuntington Beach$1.4MRedfin Data Center, July-September 2026Read the Huntington Beach guide
 CityNewport Beach$3.85MRedfin Data Center, July-September 2026Read the Newport Beach guide
 Community · Newport BeachBalboa Island$3.74MRedfin Data Center, July-September 2026Read the Balboa Island guide
 CityCorona del Mar$4.56MRedfin Data Center, July-September 2026Read the Corona del Mar guide
 CityNewport Coast$6.23MRedfin Data Center, July-September 2026Read the Newport Coast guide
 CityLaguna Beach$3.29MRedfin Data Center, July-September 2026Read the Laguna Beach guide
 CityIrvine$1.45MRedfin Data Center, July-September 2026Read the Irvine guide
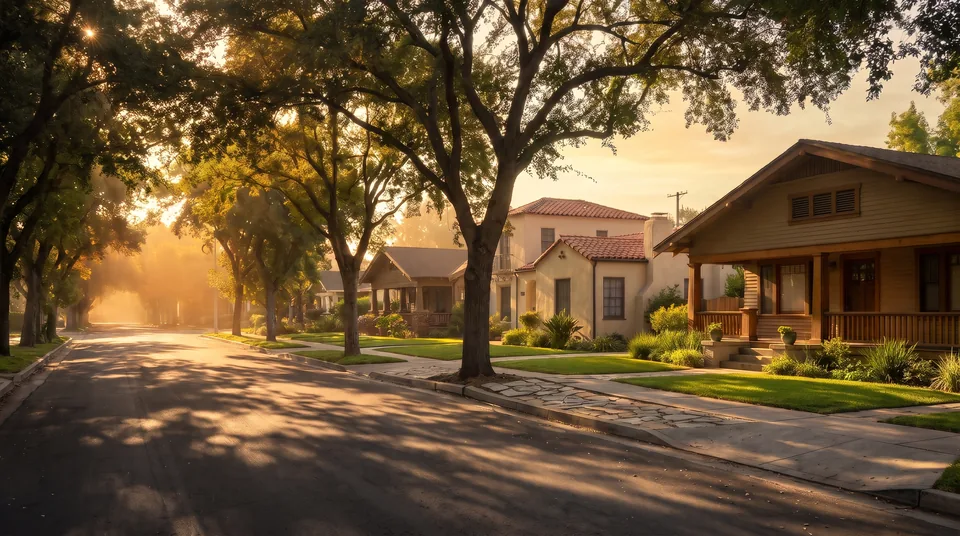 CitySanta Ana$850KRedfin Data Center, July-September 2026Read the Santa Ana guide
Every area we cover
Median sale price and median days on market · Redfin Data Center, July-September 2026
- Newport Coast$6.23M53 days
- Corona del Mar$4.56M64 days
- Newport Beach$3.85M65 days
- Laguna Beach$3.29M71 days
- Dana Point$2.1M47 days
- Costa Mesa$1.55M39 days
- Irvine$1.45M61 days
- Yorba Linda$1.45M42 days
- Fountain Valley$1.41M27 days
- Huntington Beach$1.4M43 days
- Laguna Niguel$1.37M45 days
- Mission Viejo$1.22M44 days
- Tustin$1.15M48 days
- Fullerton$1.05M40 days
- Garden Grove$1.01M32 days
- Anaheim$970K41 days
- Santa Ana$850K44 days
- Crystal Cove$14.5M71 days
- Lido Isle$12.4M96 days
- Pelican Hill$10.3M71 days
- Shady Canyon$10.2M57 days
- Big Canyon$5.9M95 days
- Dover Shores$5.7M103 days
- Harbor Ridge$4.52M219 days
- Balboa Island$3.74M85 days
- Turtle Rock$2.45M78 days
What does this month mean if you're selling?
If you are selling, the sale-to-list ratio and days on market above show how much room the market gives you on price. Homes in Orange County sold at 98.8% of list price this month. When that ratio sits near or above 100 percent, a home priced from its true comparables tends to sell close to asking; when it slips below, homes priced above their comparables tend to sit and then sell after a reduction.
Days on market is the other half. The longer the median, the more a first-month launch matters, because a listing that goes stale invites lower offers. Preparation, photography and a price grounded in recent nearby sales give a home the best chance in its first two weeks.
Your own street matters more than the county. Ask for the sales near you before you set a price, and see the selling guide for how Greg prepares and launches a home.
Greg prepares a written valuation from recent sales near you. Start with the address.
What does this month mean if you're buying?
If you are buying, the same figures tell you how much you can negotiate. When homes sell below list and days on market stretch, there is room to ask for a lower price, repairs or credits toward closing costs. When they sell at or above list within a couple of weeks, a well-priced home may draw more than one offer, and a strong first offer with clean terms matters more.
Nobody can promise where prices go next. What you can know before an offer is what similar homes on that street sold for in the last few months, which is what the lender's appraiser will look at too. See the buying guide for how Greg pulls those sales for every home a buyer is serious about.
Want the sales around a home you're watching? Greg will pull them.
Which figures are worth watching into the winter?
Three figures are worth following through the next few reports: the median days on market, the sale-to-list ratio and the number of homes sold. Sales in Orange County usually slow in the late autumn and winter months as fewer owners list around the holidays, so a dip in homes sold from October through January is normal and says little on its own.
What matters is whether the pace and the pricing change along with it. If days on market lengthen and the sale-to-list ratio falls in the same months, buyers are gaining ground. If homes keep selling close to list price even as the count drops, the market is simply quieter rather than softer. The next report, in early November, adds a month to that picture.
Where do these figures come from?
The figures in this report come from public data. When Greg adds a note from the homes he listed and showed that month, it is marked as his own observation.
How was this report made?
Every figure in this report comes from one named public source, printed beside it, and two sources are never mixed in one number. Medians use closed sales of single-family homes, condos and townhomes in the month. A city with fewer than 10 sales in a month shows no median, because a handful of sales can swing it. The 12-month change compares the month with the same month a year earlier. These figures stay in place until the November 2026 report is published, and this page keeps them afterward as a record.
The figures are general information about the market and are not an appraisal of any home. The full table for the month is available as a CSV download for anyone who wants to quote or chart it. For earlier and later months, see the Orange County market report hub.
Common questions
Are Orange County home prices going down in 2026?
Orange County's median sale price changed +0.6% on a year earlier in September 2026, according to Redfin Data Center. A single month's median moves with the mix of homes that sold, so read it beside the homes-sold count and the next few reports before calling a direction. Your own street's recent sales matter more than the county line.
Is October 2026 a good time to sell in Orange County?
Orange County homes sold at 98.8% of list price in September 2026, with a median of 47 days on market. Whether that suits a seller depends on the home, the street and the plan for the next move. A written price analysis from recent nearby sales is the first step toward deciding.
How long does it take to sell a home in Orange County?
The median Orange County home went under contract in 47 days in September 2026. Escrow then adds its own period, often about a month and sometimes less for a cash buyer, so a seller should plan the move around both, and allow longer for a top-tier home.
Where do the figures in this report come from?
Every figure in the October 2026 report comes from one public source, Redfin Data Center, named beside it. Two sources are never mixed in one number. Medians cover closed sales of single-family homes, condos and townhomes, and a city with fewer than 10 sales in the month shows no median. The method section on this page explains each step.
When is the next Orange County market report?
The next Orange County market report is published in the first ten days of November 2026 and covers October's closed sales. Each month gets its own dated page, and the market report hub always shows the newest one alongside links to every past report.
- Redfin Data Center, public monthly housing data (planned source; each figure caption names the source used) · checked 2026-10-28
- U.S. Census Bureau QuickFacts: Newport Beach, Irvine and Santa Ana (2020 population) · checked 2026-10-28
- California DRE licence lookup: Greg Toussieng · checked 2026-10-28

Start with the address. Greg does the rest.
A written valuation from recent sales near you, prepared by a licensed broker. Or call (949) 868-8820.